
Get My Proven Trading Plan For Price Action Trading That Averages Me 180-400% ROI Each Year
"I cannot ever imagine placing another trade without this incredible system" ~ Rick Hoss
STOP WASTING MONEY ON STOCK & CRYPTO TRADES THAT AREN'T TURNING A PROFIT...
And Start utilizing The "Secret" Methods & Tools I've Been Using To Consistently Hit 80% to 85% win rates

INTRODUCING
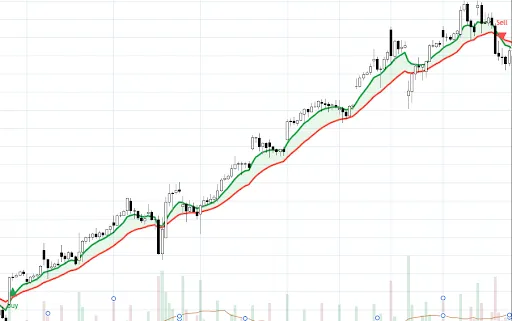
the s-curve analysis system
Learn the foundational system experienced traders use to time any market in order to make consistently profitable trades. Stop trading with emotion and start trading with confidence based on proven methods that can be applied to any strategy or timeline.
Just $295

Here's What You'll Learn:
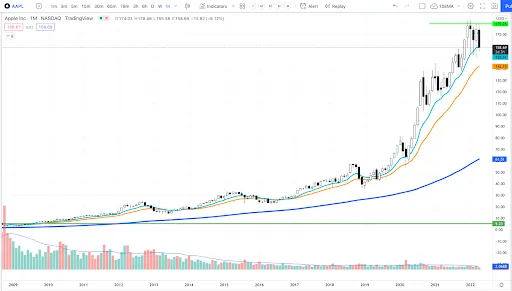
Understand how the markets move and flex so you can plan your entries and exits.
Learn how to identify trends so you can make money in any markets going up or down.
Learn the S-Curve system that can be applied to any type of stock trading including day trading, swing trading, and long term investing.
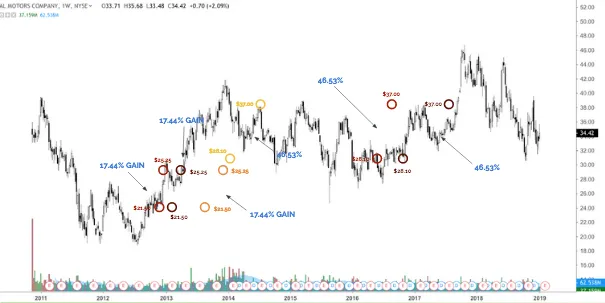
Read charts like a boss and get over two hours of market scenarios from full-time professional traders.
Learn and Understand How to Become a Profitable Trader
S Curve Analysis Course Breakdown
What You Will Learn:
Intro to S Curve Analysis
Welcome and introduction to the S Curve Analysis!
How to trade with confidence instead of emotion.
How to minimize your risk and maximize your return.
The 2 most important questions you should ask before getting into a trade.
How to analyze and interpret the market trend.
How to identify a bearish or bullish trend pattern.
Let's review TONS of real life examples!
Trading in Bullish Markets
How to quickly identify if a stock trend is bullish.
Applying the S Curve Analysis to determine whether the market will continue a bullish trend based on the lower high or higher low.
How to spot the future direction of the stock trend including the market bounce, pullback, and breakout.
When and where to place your stop loss, entry, and target in a bull market.
How to spot a pattern change from a bull market to a bear market.
Review tons of trading examples with Q&A.
Trading in Bearish Markets
How to quickly identify if a stock trend is bearish.
Applying the S Curve Analysis to determine whether the market will continue a bearish trend based on the lower high or higher low.
How to spot the future direction of the stock trend including the market bounce, pullback, and breakout.
When and where to place your stop loss, entry, and target in a bear market.
How to spot a pattern change from a bear market to a bullish market.
Review tons of trading examples with Q&A.
S Curve for Any Strategy
How the S Curve Analysis can be applied to any trading strategy.
Using candles and rules to improve your trading using the S Curve Analysis.
How experts utilize the S Curve to setup winning trades.
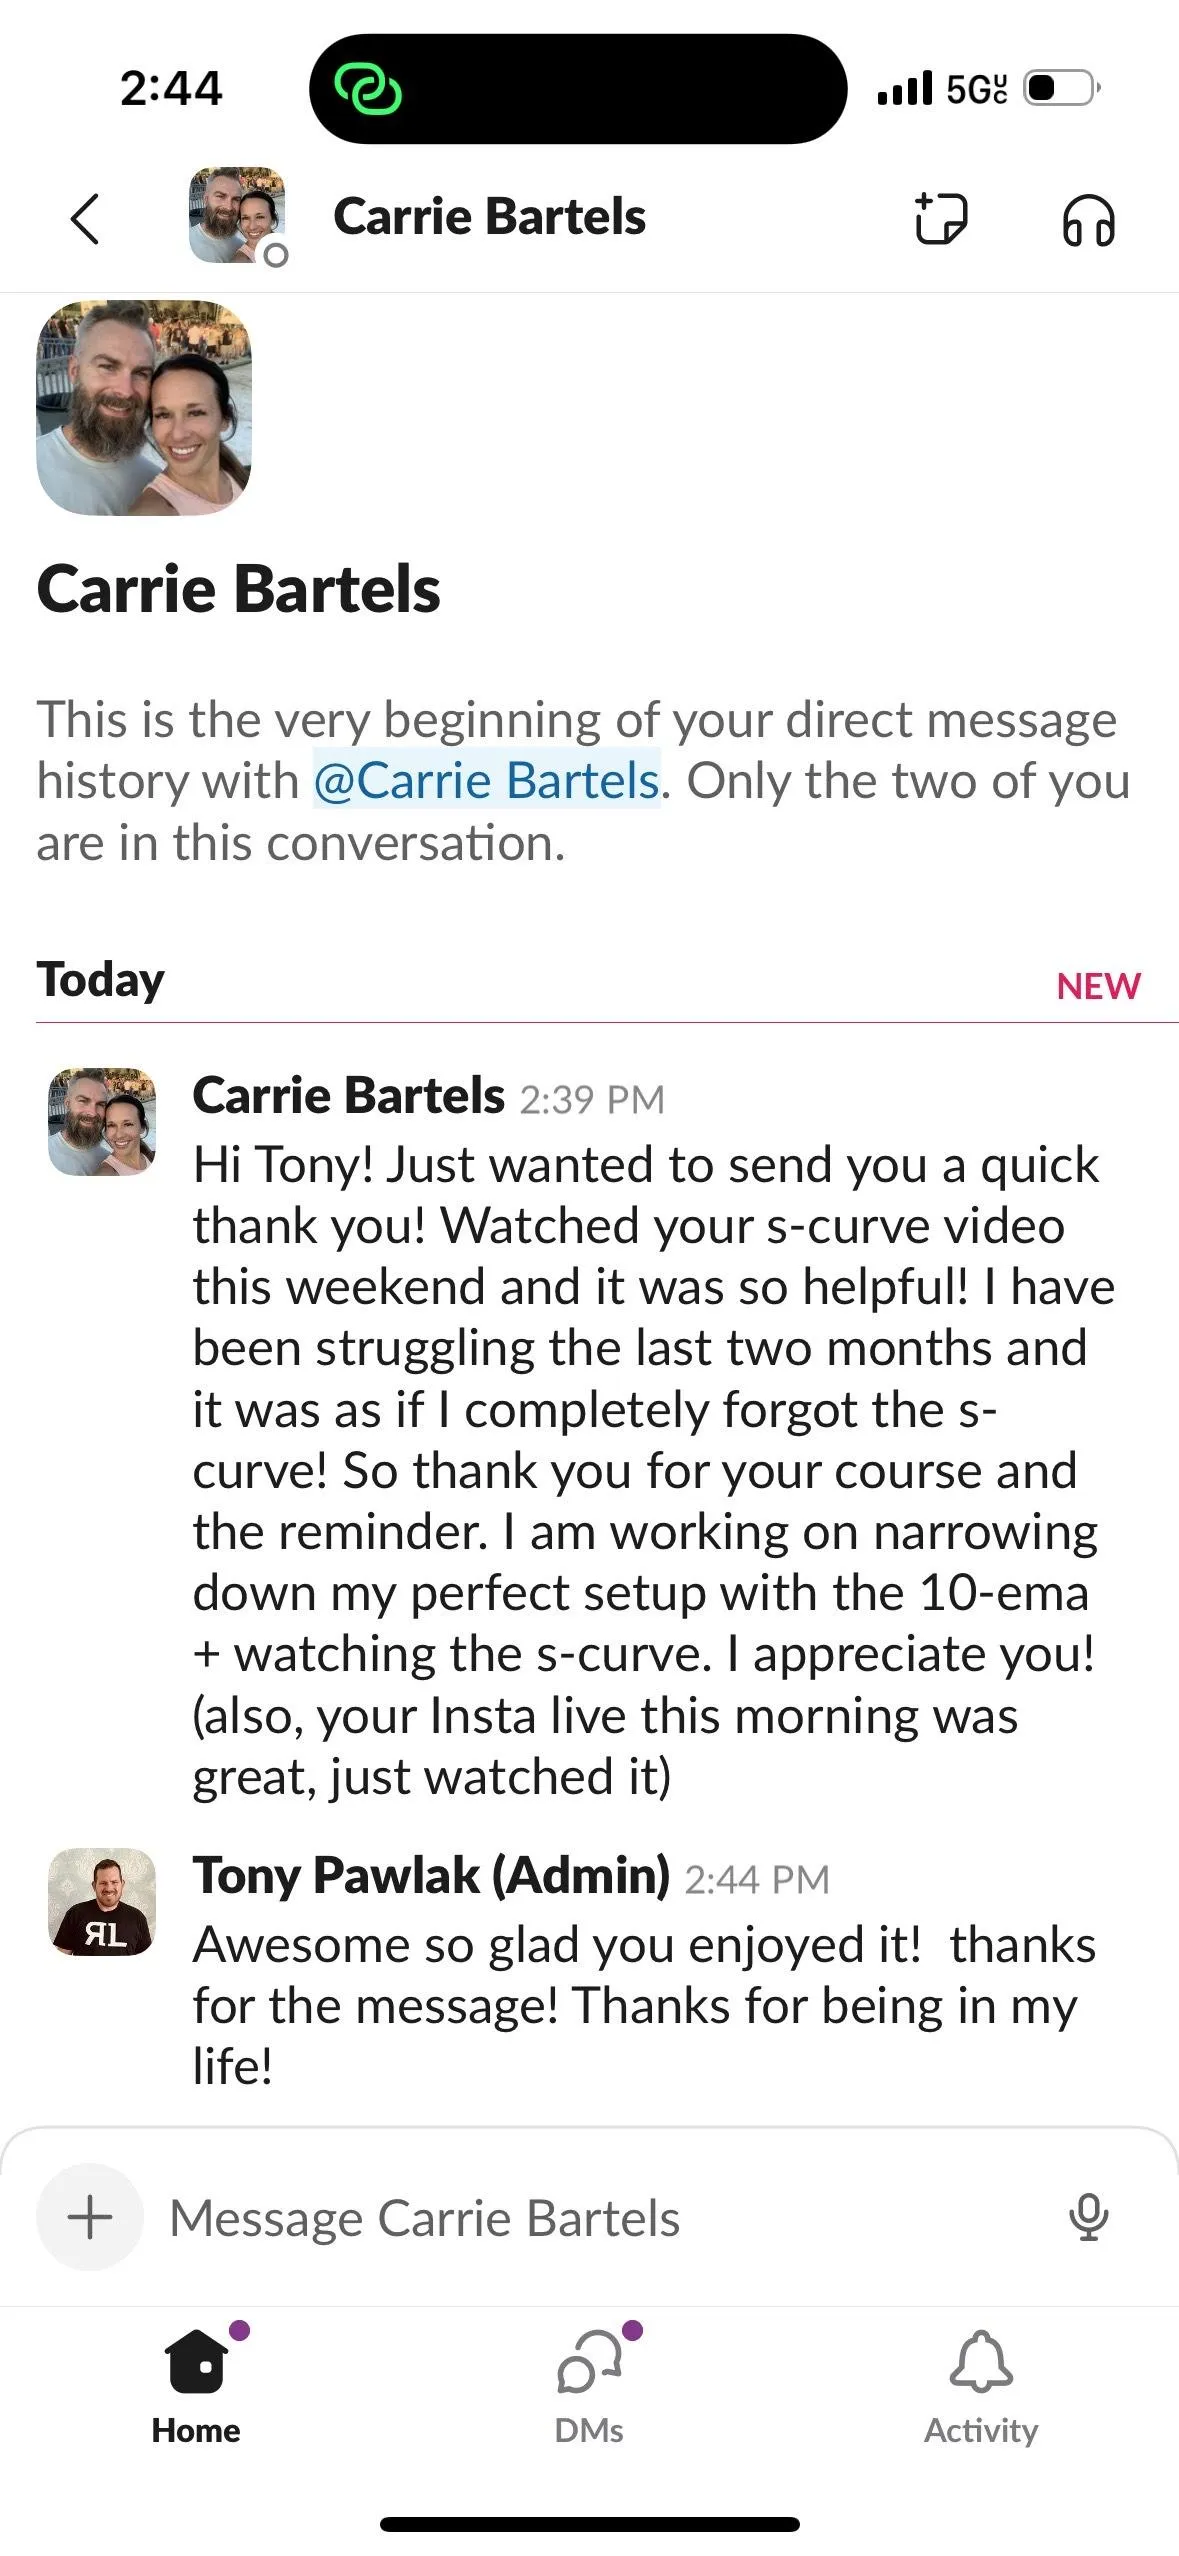
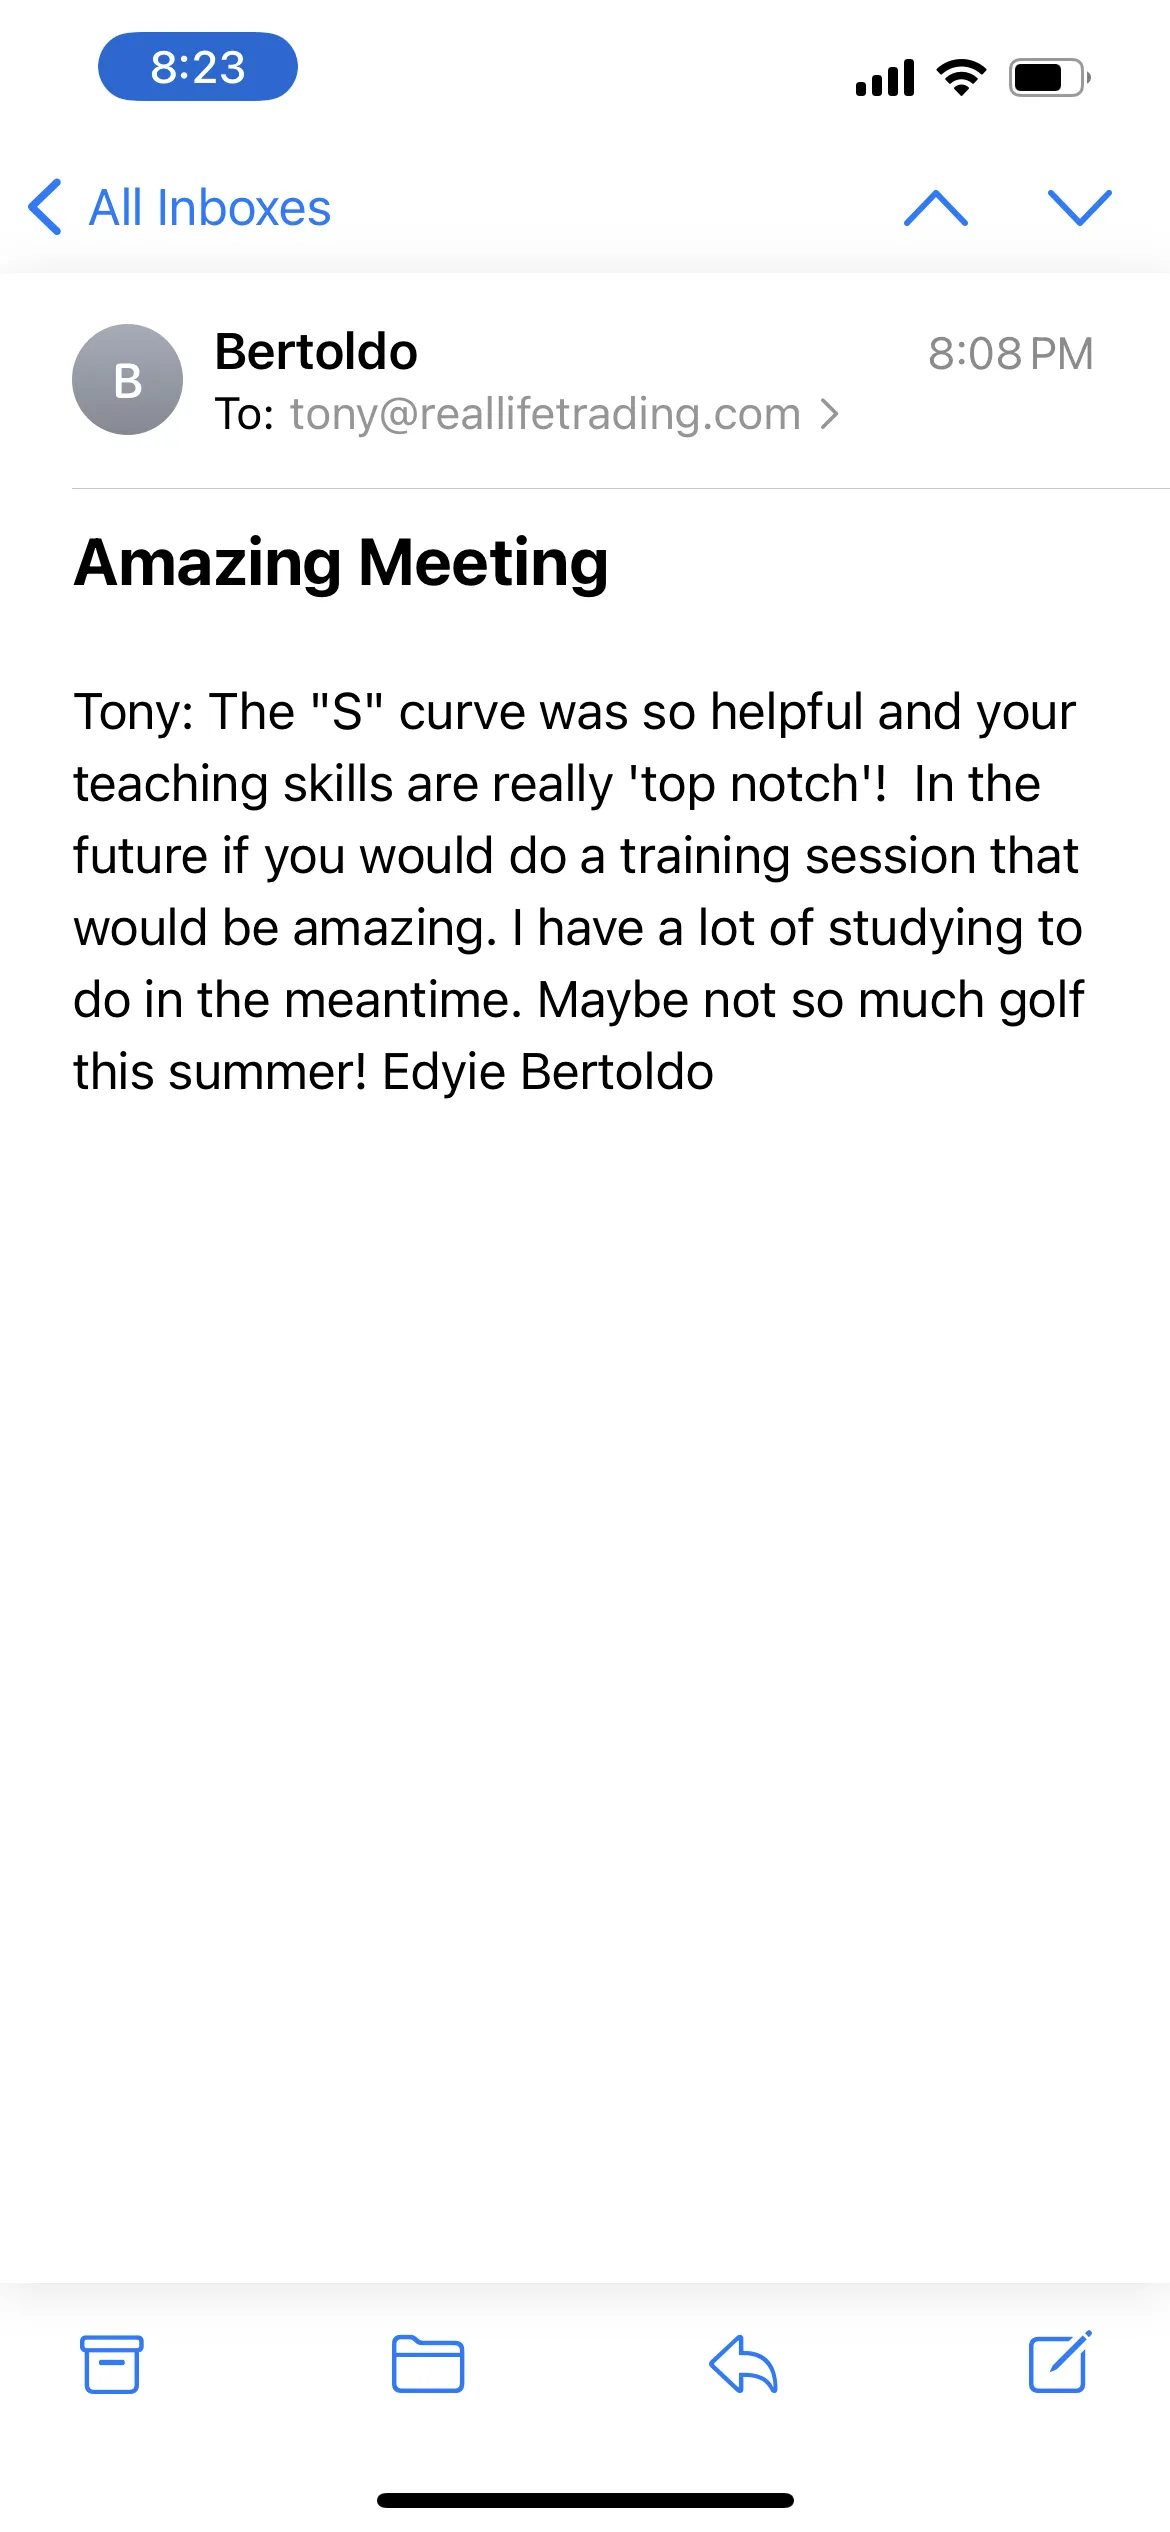
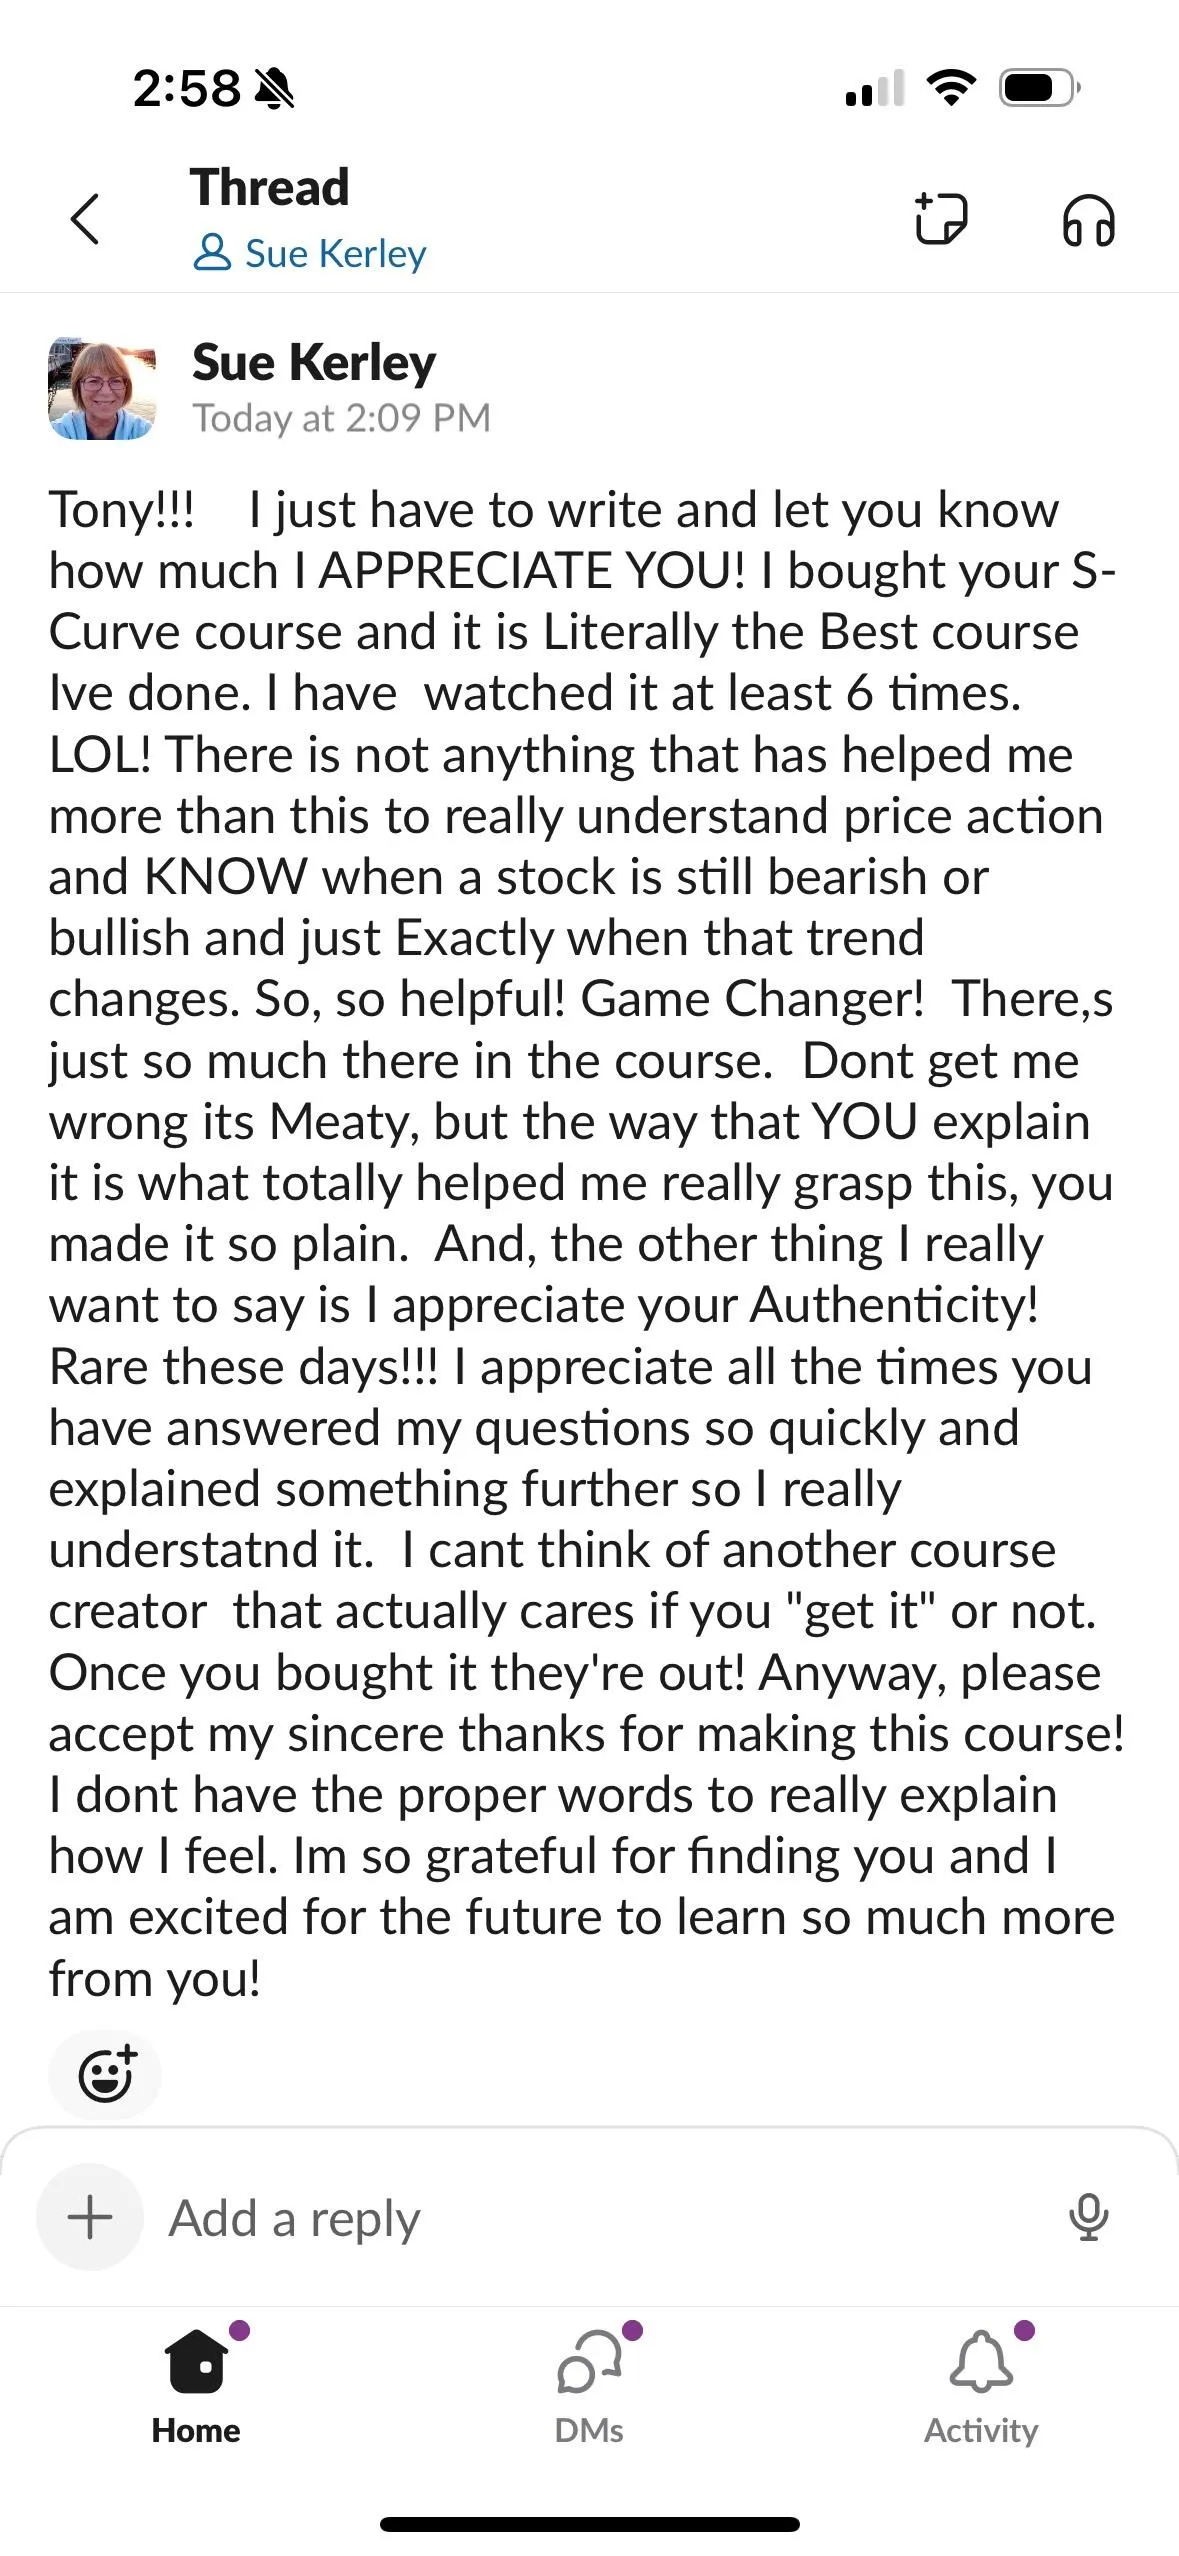
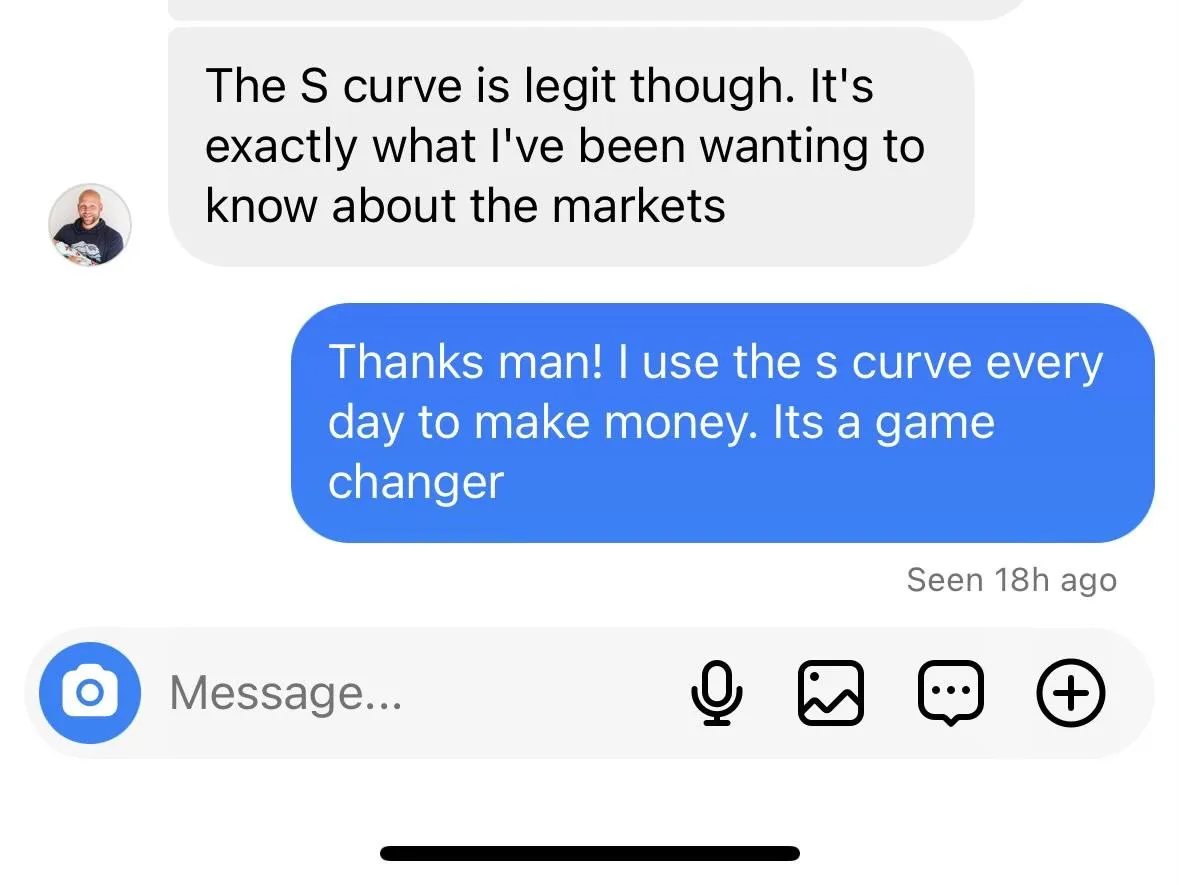
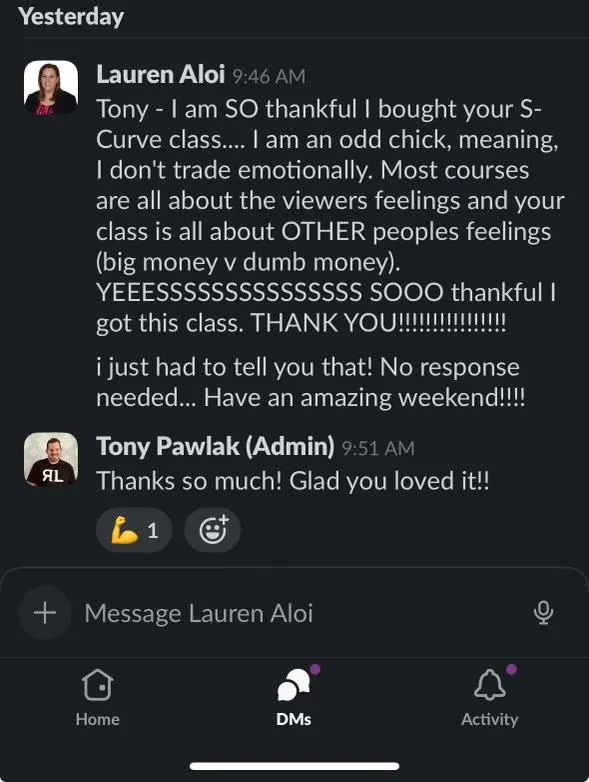
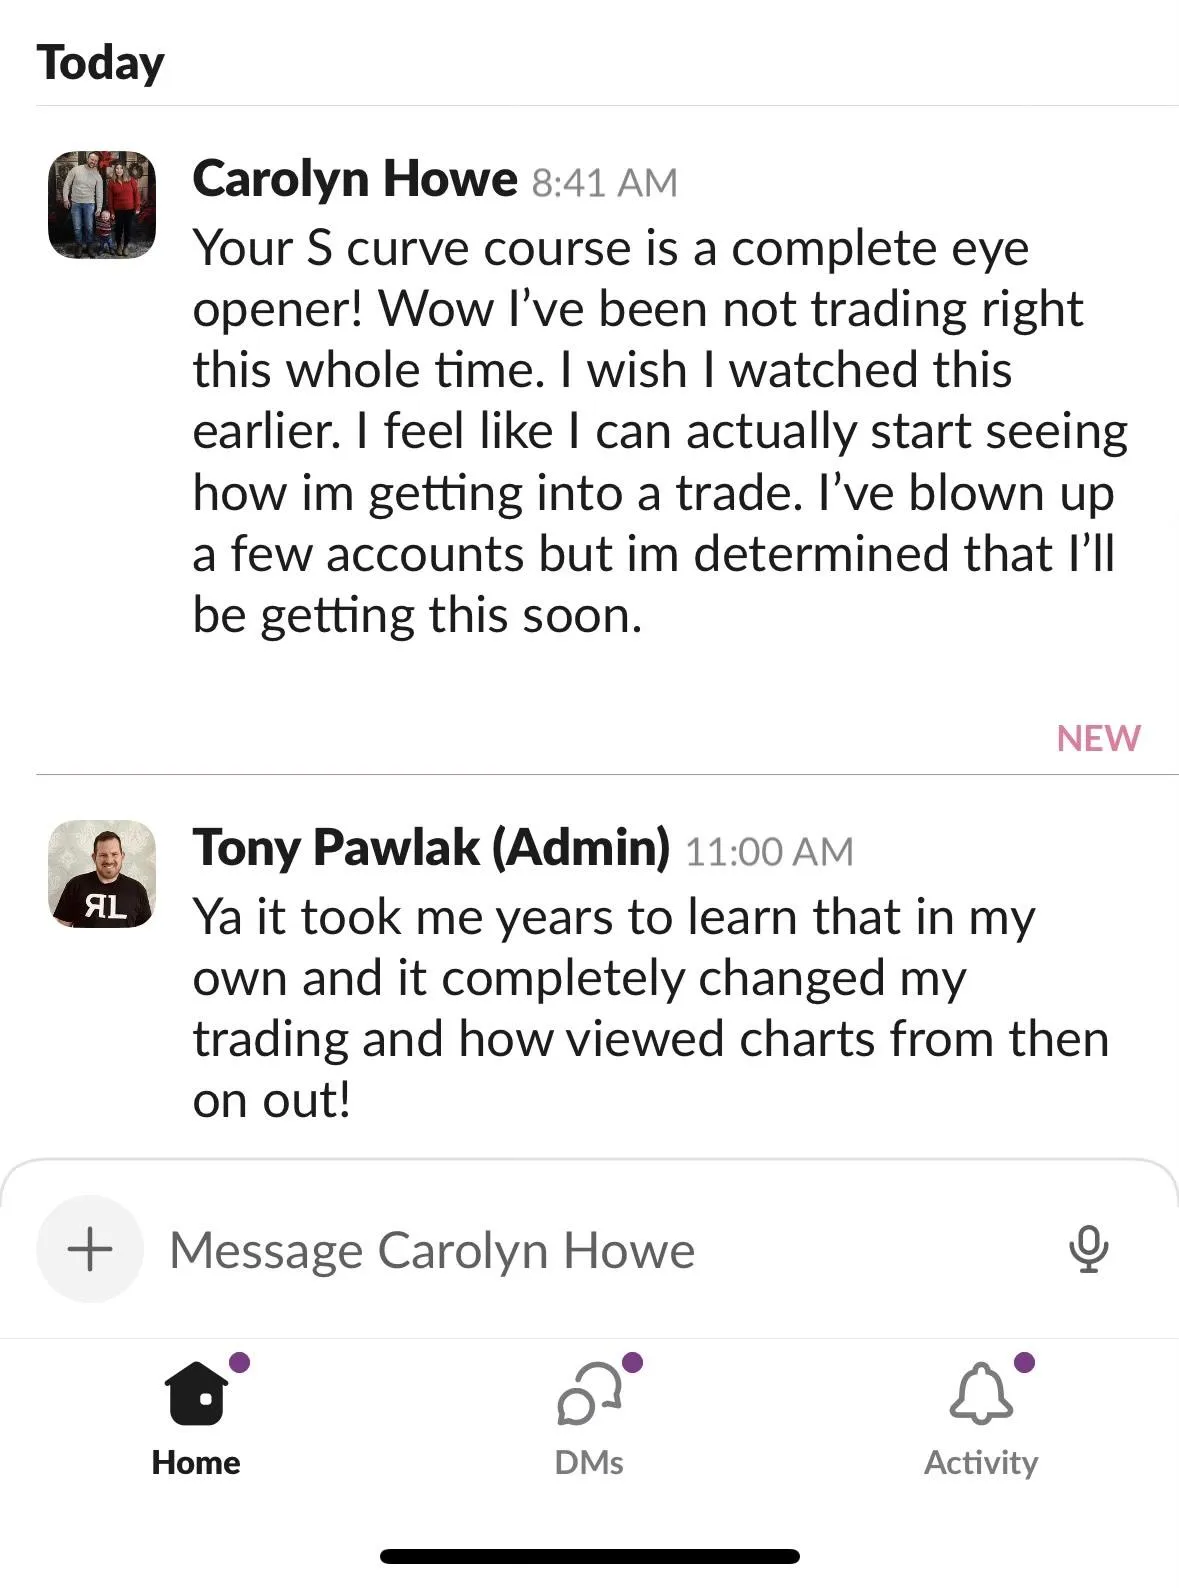
don't just take our word for it...
Here's what others have to say


"Thank you so much! I love the amazing work you are doing at RLT, and the impact you are having in the life of so many people. I feel so enlightened after taking this course. I am excited to implement everything I have learned from you and this community."

─ Farel Billy
"Tony and his team are 100% genuine people that are interested in changing lives for the better in so many ways. They exist to help you achieve your goals in investing using many different strategies. They will not rip you off and offer a great education."
─ CLINTON BAKER
"The RLT family and experience has been a game-changer for me! It is educational and inspirational. This course helped me build a strong foundation that helped shorten the learning curve and build confidence. Truly a great place to start and grow as a trader."
─ JOSH WILLINGHAM

So If You're Tired Of...
Not having a consistent income stream from trading
Not knowing when and where to invest and reinvest
Increasing your account only to lose that money & start again
Not knowing how to read the market, charts and getting stuck
TERMS & CONDITIONS
Results may not be typical and may vary from person to person. Making money trading stocks, futures, options, and options on futures, takes time, dedication, and hard work. There are inherent risks involved with investing in stocks, futures, options, and options on futures, including the loss of your investment and in some cases, more. Past performance in the market is not indicative of future results. Any investment is at your own risk. See Terms of Service.
The MasterClass Details
Week 1-(Oct 3-7)
INTRO + Expectations Intro to candlesticks, day trading vs swing trading (DJ + JN + SK + XR), money management concepts, 3 parts to strategy: entry, exit/win,exit/loss, risk management, R sizing & intro to trading plans.
Week 2-(Oct 10-14)
Demo account + order entry + order types, sample slides for order types, technical analysis & market sentiment, intro to backtrading in tradingview, daily checklists & journaling trades, backtrading practice & journal back trades.
Week 1-(Oct 3-7)
INTRO + Expectations Intro to candlesticks, day trading vs swing trading (DJ + JN + SK + XR), money management concepts, 3 parts to strategy: entry, exit/win,exit/loss, risk management, R sizing & intro to trading plans.

Week 2-(Oct 10-14)
Demo account + order entry + order types, sample slides for order types, technical analysis & market sentiment, intro to backtrading in tradingview, daily checklists & journaling trades, backtrading practice & journal back trades.
Week 3-(Oct 17-21)
Order entry practice & becoming a CPT (Consistent Profitable Trader), review 10 EMA 30/min TSLA + BTC strategy, paper trade 10 EMA 30 /min TSLA + BTC strategy LIVE, 1- EMA 30/min TSLA + BTC strategy intro & written plan.
Week 4-(Oct 24-28)
Backtrade 10 EMA 30/min TSLA+BTC strategy
Week 5-(Oct 31-Nov 4)
Intro 15/min ROKU strategy & written plan w/ alerts, review 15/min ROKU strategy, mindset and fear discussion, paper trade 15/min ROKU strategy LIVE.
Week 6-(Nov 7-11)
Trade 15/min ROKU strategy LIVE and during market hours, practice our ROKU strategy during the market open, practice ROKU trading system LIVE, implement our ROKU trading system LIVE.
Week 7-(Nov 14-18)
S-curve, candle sentiment & volume back trading part 1, 2, and 3.
Week 8-(Nov 21 -25)
Calculating risk time DRILLS, order entry DRILLS, moving stops + target DRILLS, analyzing trend DRILLS.
Week 9-(Nov 21 -25)
Calculating risk time DRILLS, order entry DRILLS, moving stops + target DRILLS, analyzing trend DRILLS.
Weeks 10-12(Dec 5-23)
Trade strategy 1+2 and review trades